Laman

New

a

Tampilkan postingan dengan label debugging. Tampilkan semua postingan

Senin

examine macro definition in gdb

When debugging a c++ application, I used to refer to source code to find out the actual definition of a macro. If the macro is not a simple one, I had to perform the expansion on a paper or use the 'gcc -E' command to find out what's the actual result. This is a tedious task. The gdb macro command helps examine the macro value, as long as the application under debugging contains information about preprocessor macros. This can be satisfied by passing -g3 option to the gcc compiler. As an example, we need to debug the application below
 1 #define FOO foo_value
 2 #define STR(val) "STR of "#val
 3 #define VAL STR(FOO)
 4 
 5 int main(int argc, const char *argv[])
 6 {
 7     const char* t = VAL;
 8 #undef VAL
 9 #define VAL "test" // define VAL to a different value 
10     const char* t2 = VAL;
11 
12     return 0;
13 }
We compile the code with gcc -g3 command, and debug it in gdb. Then we can examine the actual value of VAL macro with macro exp command.
(gdb) macro exp VAL  // run when break on line 7
expands to: "STR of ""FOO"
....
(gdb) macro exp VAL // run when break on line 10
expands to: "test"
It's worthy of note that the macro expansion is context awareness in gdb, so we can get different value when the application breaks on line 7 and 10.

Kamis

debug linux kernel with gdb

People often use gdb to debug user mode applications, which is a convenient debugging means. It's also possible to use gdb to debug linux kernel and drivers with the help of kgdb. This page is a good tutorial for how to use kgdb.

Benefits of using gdb to debug kernel

  • It helps us understanding linux internals. In linux, it's very common to see structures with a lot of function pointer members being passed around. And it's not easy to find out where and how these function pointers are actually called by reading code. By setting breakpoint on the function, we can easily find how linux call into it.
  • It saves the debugging time. If we only debug by printk, we usually have to compile and deploy linux kernel multiple times to fix a minor bug. It's more efficient to debug if we can step through the code and see all variables' value in real time.

Preparations

As the precedent document illustrates, to enable kgdb for a kernel, we need to:
  • Enable kernel config options for kgdb
  • Provide a polling tty driver for the kgdboc I/O driver.
  • Set linux boot argument to instruct linux kernel use our kgdb I/O driver

How to complete a kgdb I/O driver

Linux contains a kgdb I/O driver, kgdboc, short for kgdb over console. It's acutally a thin driver that relies on low level hardware driver supporting polling operation. This low level driver must be implemented by us.
To complete the polling driver, we need to implement poll_get_char and poll_put_char callbacks in the UART driver. There is a good example for us to follow in linux source code: 8250.c.

How to debug if there is only one serial port

kgdboc is designed to work when there is only one serial port on our board. The serial port can be used as primary console as well as the communication channel with gdb. In this case, we should first connect our serial port client (e.g., kermit) to the console and input 'echo g > /proc/sysrq-trigger' command to break into linux kernel. Now linux should halt and wait for a gdb client to connect. Then we exit the serial port client process and start a gdb client to connect to the linux on the same serial port. It's time-division multiplexing on the serial port.
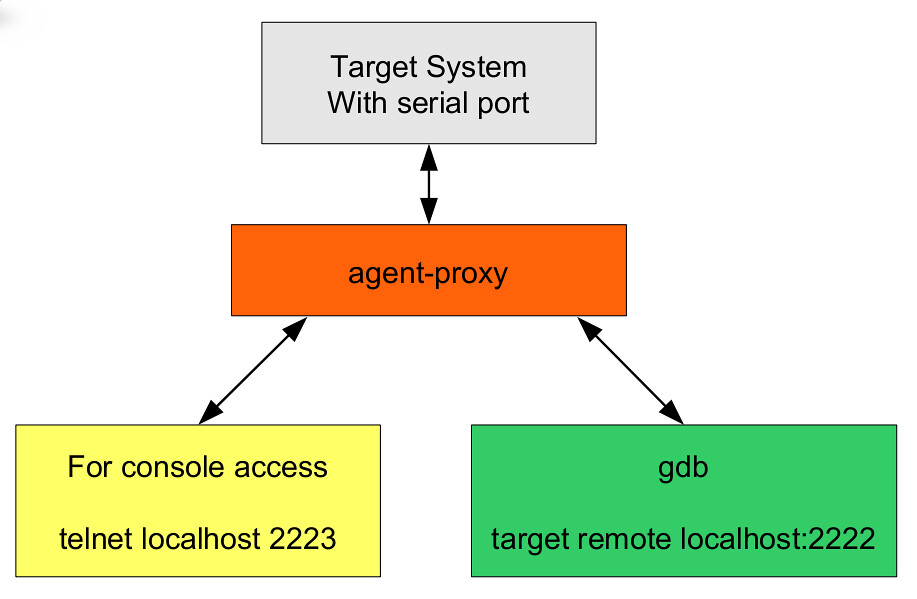
The agent-proxy make the process even easier. agent-proxy is a tty to tcp connection mux that allow us connect more than one client application to a tty. By using it, we can run the serial port client and gdb process simultaneously. aa

How to debug linux initialization code

If we specify kgdbwait parameter in kernel boot args, the kernel will halt automatically during the initialization process and wait for a gdb client to connect. There are several things to note:
  • The kgdb core tries to break the execution as soon as a kgdb io driver is registered, which is done while the kgdboc module is initialized. As a result, it's necessary to set kgdboc module as built-in, rather than a module.
  • Our UART driver must be initialized before the kgdboc driver. Or the kgdboc driver will fail to initialize. Becuase there isn't a reliable way to specify loading order for built-in modules at the same level, it's better to specify our UART driver at a precedent level than kgdboc, for instance, fs_initcall.
  • The module initialization is called through this call stack: start_kernel -> rest_init -> kernel_init -> do_basic_setup -> do_initcalls. So, we can't debug code earlier than do_initcalls.

How to debug loadable module

When we need to debug a loadable module, we should add the ko file with symbol information to gdb with add-symbol-file command. We must provide the module's load address explicitly. How can we find out where the module is loaded? After we've insmod the module, we can find out the load address of the module by either read the /proc/modules pseudo file or use info shared command in gdb. But what if we need to debug the module_init function? It will be too late to set breakpoint after we've alreay loaded the module to find out its load address. We can solve this dilemma by setting a breakpoint in sys_init_module after the load_module function returns. And we can find out the module's load address with p mod->module_core command in gdb. We can add symbol file at this point and set a breakpoint in the actual module_init function. Or we can set a breakpoint in do_one_initcall.

Senin

ease android stacktrace examination in vim with agdb

Continue the post view call stack of crashed application on android.
The agdb tool is able to convert PC register to source file information, but not convenient enough. After agdb outputs source file information, we still need to open the source file in vim and jump to the corresponding line manually.
Now agdb tool can generate a vim specific error file for the stacktrace to help us jump to source code directly.
Still consider the stacktrace below:


22 F/ASessionDescription(   33): frameworks/base/media/libstagefright/rtsp/ASessionDescription.cpp:264 CHECK_GT( end,s) failed:  vs.
23 I/DEBUG   (   30): *** *** *** *** *** *** *** *** *** *** *** *** *** *** *** ***
24 I/DEBUG   (   30): Build fingerprint: 'generic/generic/generic:2.3.1/GINGERBREAD/eng.raymond.20101222.130550:eng/test-keys'
25 I/DEBUG   (   30): pid: 33, tid: 450  >>> /system/bin/mediaserver <<<
26 I/DEBUG   (   30): signal 11 (SIGSEGV), code 1 (SEGV_MAPERR), fault addr deadbaad
27 I/DEBUG   (   30):  r0 deadbaad  r1 0000000c  r2 00000027  r3 00000000
28 I/DEBUG   (   30):  r4 00000080  r5 afd46668  r6 40806c10  r7 00000000
29 I/DEBUG   (   30):  r8 8031db1d  r9 0000fae0  10 00100000  fp 00000001
30 I/DEBUG   (   30):  ip ffffffff  sp 40806778  lr afd19375  pc afd15ef0  cpsr 00000030
31 I/DEBUG   (   30):          #00  pc 00015ef0  /system/lib/libc.so
32 I/DEBUG   (   30):          #01  pc 00001440  /system/lib/liblog.so
33 I/DEBUG   (   30):
34 I/DEBUG   (   30): code around pc:
35 I/DEBUG   (   30): afd15ed0 68241c23 d1fb2c00 68dae027 d0042a00
36 I/DEBUG   (   30): afd15ee0 20014d18 6028447d 48174790 24802227
37 I/DEBUG   (   30): afd15ef0 f7f57002 2106eb56 ec92f7f6 0563aa01
38 I/DEBUG   (   30): afd15f00 60932100 91016051 1c112006 e818f7f6
39 I/DEBUG   (   30): afd15f10 2200a905 f7f62002 f7f5e824 2106eb42
40 I/DEBUG   (   30):
41 I/DEBUG   (   30): code around lr:
42 I/DEBUG   (   30): afd19354 b0834a0d 589c447b 26009001 686768a5
43 I/DEBUG   (   30): afd19364 220ce008 2b005eab 1c28d003 47889901
44 I/DEBUG   (   30): afd19374 35544306 d5f43f01 2c006824 b003d1ee
45 I/DEBUG   (   30): afd19384 bdf01c30 000281a8 ffffff88 1c0fb5f0
46 I/DEBUG   (   30): afd19394 43551c3d a904b087 1c16ac01 604d9004
47 I/DEBUG   (   30):
48 I/DEBUG   (   30): stack:
49 ........................
92 I/DEBUG   (   30):     408067e4  6f697470
93 I/BootReceiver(   75): Copying /data/tombstones/tombstone_09 to DropBox (SYSTEM_TOMBSTONE)

We run this command to convert it to vim error file:
agdb.py -v < tombstone_01.txt > vim_error_file
# the -v argument tells agdb to generate a vim error file

Then in vim, we run :cg vim_error_file to load the error file to vim's quickfix buffer.
After the error file is loaded, we run :cw command in vim to examine the call stack. It's shown below:

1 pid: 33, tid: 450  >>> /system/bin/mediaserver <<<
2 /path_to_android_src_root/bionic/libc/unistd/abort.c:82: #00 __libc_android_abort
3 /path_to_android_src_root/system/core/liblog/logd_write.c:235: #01 __android_log_assert
Now we can focus on the line that we'd like to further investigate, and press enter. Vim will bring us the the exact line that the error corresponds to.

The idea of the feature is very simple. As we vim users know, vim is able to recognize lots of compilers' error message. The agdb tool converts the format of stacktrace to gcc compiler's error format, then vim can load the output to quickfix and associate lines with corresponding source code.

addr2line for windows

While debugging os or application crash bug on windows ce (the tool winaddr2line isn't particularly used for windows CE application, it can be used for normal windows application too.) platform, developers may not always have the luxury to debug step by step within a IDE. Most of time, the only information available to us is the output on serial port. (It's already very fortunate if we can see serial port output every time a crash happens.) What we get is something like:
Exception 'Data Abort' (4): Thread-Id=06890fba(pth=88eb8948), Proc-Id=06750f9e(pprc=88eb8828) 'test.exe', VM-active=06750f9e(pprc=88eb8828) 'test.exe'
PC=00011048(test.exe+0x00001048) RA=00011018(test.exe+0x00001018) SP=0002fb98, BVA=00000000


Unhandled exception c0000005:
Terminating thread 88eb8948

Given the PC register value, we need to figure out on while line in our code did the application crash. winaddr2line makes it an easy task as long as we have the pdb symbol file for the application. It's a attempt to port addr2line to windows world.
Let's take the preceding log for example. In order to find out the line number of the code that incurs the crash, we need following information.
  1. In which module did the crash happen
  2. What's the address can we use to query
For question 1, the module name is already available in the log. In our example, it's test.exe. For question 2, we can see the PC register's value is 0x00011048. So, we run "winaddr2line.exe -e test.exe 11048 -a -p -s -f" command, and get this: "0x00011048: foo::crash at test.cpp:8". Now we open test.cpp and check what's around line 8, the root cause is very obvious.

 1
 2 class foo
 3 {
 4     public:
 5         void crash()
 6         {
 7             int *a = NULL;
 8             int b = *a;
         }
10 };
11
12 int main ( int argc, char *argv[] )
13 {
14     foo f;
15     f.crash();
16     return 0;
17 }       

In order for the preceding command to work correctly, we must make sure the test.exe and its symbol file test.pdb is available in current directory of the shell that we run winaddr2line. If it's not the case, we should pass correct path to test.exe for -e argument and path to directory containing test.pdb for -y argument respectively.

In the example, we use PC register's value directly to query line number. But it's not always the case. Consider the crash log below:
Exception 'Raised Exception' (-1): Thread-Id=06891422(pth=88eb8948), Proc-Id=0675143e(pprc=88eb8828) 'test.exe', VM-active=0675143e(pprc=88eb8828) 'test.exe'
PC=4006d270(coredll.dll+0x0005d270) RA=80118a60(kernel.dll+0x00007a60) SP=0002fb8c, BVA=00000000


Unhandled exception c0000094:
Terminating thread 88eb8948

The crash occurred in coredll.dll module. We run command "winaddr2line.exe -e coredll.dll 4006d270 -a -p -s -f", but we can see it fails to find the line number. This is because we can't use the PC register's value directly here. The coredll.dll is loaded at 0x40010000 (0x4006d270-0x0005d270), which is different from its preferred ImageBase address (0x10000000, which can be examined with "dumpbin /headers coredll.dll" command). And winaddr2line can only make use of the ImageBase address contained statically in PE header of the binary. So, we must change the address to 0x1005d270 (0x10000000+0x0005d270). By using this address, we can see the crash occured at: d:\dublin2-1\private\winceos\coreos\core\dll\crtsupp.cpp:240

Source code for winaddr2line:
http://code.google.com/p/winaddr2line/

view call stack of crashed application on android

On android, when a process crashes in native code, the call stack of the process will be saved to a log file in /data/tombstomes/, and written to logcat as well. The information is helpful for debugging.
Unfortunately, the call stack doesn't show in human readable format, file name, function name. Instead, it's shown as module name (e.g., libc.so) and memory address of the instruction. We can use addr2line to translate the address to corresponding file name and function name if we have the binary of the module that contains symbol information.
To make it easier to use, this function is included in agdb tool (see here for more). We can use "agdb.py -r -e module_name address" to find out the function name of specified address within the module.

When we have a long call stack, instead of running the command above for each line in the call stack manually, we can feed the whole call stack to agdb through pipe and get the full resolved call stack. For example, use  "adb logcat | agdb.py -r" command for adb logcat output with below contents:

22 F/ASessionDescription(   33): frameworks/base/media/libstagefright/rtsp/ASessionDescription.cpp:264 CHECK_GT( end,s) failed:  vs.
23 I/DEBUG   (   30): *** *** *** *** *** *** *** *** *** *** *** *** *** *** *** ***
24 I/DEBUG   (   30): Build fingerprint: 'generic/generic/generic:2.3.1/GINGERBREAD/eng.raymond.20101222.130550:eng/test-keys'
25 I/DEBUG   (   30): pid: 33, tid: 450  >>> /system/bin/mediaserver <<<
26 I/DEBUG   (   30): signal 11 (SIGSEGV), code 1 (SEGV_MAPERR), fault addr deadbaad
27 I/DEBUG   (   30):  r0 deadbaad  r1 0000000c  r2 00000027  r3 00000000
28 I/DEBUG   (   30):  r4 00000080  r5 afd46668  r6 40806c10  r7 00000000
29 I/DEBUG   (   30):  r8 8031db1d  r9 0000fae0  10 00100000  fp 00000001
30 I/DEBUG   (   30):  ip ffffffff  sp 40806778  lr afd19375  pc afd15ef0  cpsr 00000030
31 I/DEBUG   (   30):          #00  pc 00015ef0  /system/lib/libc.so
32 I/DEBUG   (   30):          #01  pc 00001440  /system/lib/liblog.so
33 I/DEBUG   (   30):
34 I/DEBUG   (   30): code around pc:
35 I/DEBUG   (   30): afd15ed0 68241c23 d1fb2c00 68dae027 d0042a00
36 I/DEBUG   (   30): afd15ee0 20014d18 6028447d 48174790 24802227
37 I/DEBUG   (   30): afd15ef0 f7f57002 2106eb56 ec92f7f6 0563aa01
38 I/DEBUG   (   30): afd15f00 60932100 91016051 1c112006 e818f7f6
39 I/DEBUG   (   30): afd15f10 2200a905 f7f62002 f7f5e824 2106eb42
40 I/DEBUG   (   30):
41 I/DEBUG   (   30): code around lr:
42 I/DEBUG   (   30): afd19354 b0834a0d 589c447b 26009001 686768a5
43 I/DEBUG   (   30): afd19364 220ce008 2b005eab 1c28d003 47889901
44 I/DEBUG   (   30): afd19374 35544306 d5f43f01 2c006824 b003d1ee
45 I/DEBUG   (   30): afd19384 bdf01c30 000281a8 ffffff88 1c0fb5f0
46 I/DEBUG   (   30): afd19394 43551c3d a904b087 1c16ac01 604d9004
47 I/DEBUG   (   30):
48 I/DEBUG   (   30): stack:
49 ........................
92 I/DEBUG   (   30):     408067e4  6f697470
93 I/BootReceiver(   75): Copying /data/tombstones/tombstone_09 to DropBox (SYSTEM_TOMBSTONE)

we get:


22 F/ASessionDescription(   33): frameworks/base/media/libstagefright/rtsp/ASessionDescription.cpp:264 CHECK_GT( end,s) failed:  vs.
23 I/DEBUG   (   30): *** *** *** *** *** *** *** *** *** *** *** *** *** *** *** ***
24 I/DEBUG   (   30): Build fingerprint: 'generic/generic/generic:2.3.1/GINGERBREAD/eng.raymond.20101222.130550:eng/test-keys'
25 I/DEBUG   (   30): pid: 33, tid: 450  >>> /system/bin/mediaserver <<<
26 I/DEBUG   (   30): signal 11 (SIGSEGV), code 1 (SEGV_MAPERR), fault addr deadbaad
27 I/DEBUG   (   30):  r0 deadbaad  r1 0000000c  r2 00000027  r3 00000000
28 I/DEBUG   (   30):  r4 00000080  r5 afd46668  r6 40806c10  r7 00000000
29 I/DEBUG   (   30):  r8 8031db1d  r9 0000fae0  10 00100000  fp 00000001
30 I/DEBUG   (   30):  ip ffffffff  sp 40806778  lr afd19375  pc afd15ef0  cpsr 00000030
31 I/DEBUG   (   30):          #00  pc 00015ef0  /system/lib/libc.so
32 I/DEBUG   (   30):          #00  __libc_android_abort: abort.c:82
33 I/DEBUG   (   30):          #01  pc 00001440  /system/lib/liblog.so
34 I/DEBUG   (   30):          #01  __android_log_assert: logd_write.c:235
35 I/DEBUG   (   30):
36 I/DEBUG   (   30): code around pc:
37 I/DEBUG   (   30): afd15ed0 68241c23 d1fb2c00 68dae027 d0042a00
38 I/DEBUG   (   30): afd15ee0 20014d18 6028447d 48174790 24802227
39 I/DEBUG   (   30): afd15ef0 f7f57002 2106eb56 ec92f7f6 0563aa01

Similarly, we copy a tombstone file to our development pc, and use "cat tombstone_01.txt | agdb.py -r" command to resolve call stack addresses in the tombstone log file.

Senin

avoid memory leak in osip

I was debugging memory leak bugs recently. The bug was caused by incorrect usage of the osip library. It's not uncommon that we meet problems when we rely on a library or framework that we don't fully understand.


Symptom and debugging
The symptom is our application ran more and more slowly, and eventually crashed. This seemed very likely to be caused by resource leak. And after ran performance monitor against our application, it's further confirmed that memory was leaking. The virtual bytes, private bytes of the process was continuously increasing.
With the help of umdh.exe, we can find out exact lines of code that were leaking memory. It showed all stack traces of currently allocated memory blocks (including blocks that were either being used or leaked, so we must identify which blocks were in use and which were not) at the moment of dumping.


Causes
The causes of the memory leak is mainly caused by not understanding below items well.

  • transaction isn't destroyed automatically
Osip doesn't take full responsibility of managing life time of transactions. Though osip invokes callbacks registered with osip_set_kill_transaction_callback when a transaction is to be terminated, the transaction isn't freed automatically. This is supposed to be done by osip users.
The first thought I had is to call osip_transaction_free inside the kill_transaction callback, but it was wrong. Because the transaction is still accessed after the kill_transaction callback returned. So, a possible point to free transactions is to do it at the end of an iteration of the main loop, after all events have been handled.
I just don't get why this important point isn't mentioned in the official document.
  • inconsistent resource management model
In osip, there are inconsistency between APIs about how memories are managed. For example, we call osip_message_set_body to set the body of a sip message, this function internally duplicates the string we passed to it. So, we can (and need to) free the string passed to it after the function finishes. But when we want to call osip_message_set_method, be cautious! This function doesn't duplicate the string passed in, instead, it simply references the string we gave it. So, we can't free the string which is now owned by the sip message.
Such inconsistency makes it extremely easy to get confused and write code that either crashes or leaks.

Kamis

perform profiling on windows ce

Profiling is an effective way of finding out bottlenecks in an application. On windows ce platform, profiling can also be done easily.

To perform profiling for native code, we can use the /callcap compiler option to enable callcap profiling. After it's enabled, the compiler will inject method invocation to _CAP_Enter_Function and _CAP_Exit_Function upon entering and returnning from a function respectively. We can print or log current time in these method to achieve profiling.
It's notable that while compiling the source file contains _CAP_Enter_Function and _CAP_Exit_Function's definition, we must disable /callcap option, otherwise, these function will call themself recursively. In most cases, it's a wise idea to create a library project to implement these profiling hook fuction and trun /callcap off for the project. Then link the library to other applications to be profiled.
For demonstration, here is a visual studio project shows how to do profiling:
http://code.google.com/p/rxwen-blog-stuff/source/browse/trunk/wince/ce_profiling/

After we run the application, we get below output:
Enter function (at address 00011068) at 73875892
Enter function (at address 00011030) at 73875897
Enter function (at address 00011000) at 73875902
bar
Leaving function (at address 00011000) at 73876907
foo
Leaving function (at address 00011030) at 73879912
Leaving function (at address 00011068) at 73879916
 
As you can see, it's a very rough sample that only prints the address of function being called. Not convenient to analyse. We may improve it by mapping and translating the address to function name, because we, as the application developer, possess the private symbol file. This task doesn't need to be done on the windows ce box, it's much easier to save the log file then parse and analyse it on a pc.

References:
Remote call profiler
A tour of windows ce performance tools

Rabu

debugging python script in ipython

ipython doesn't work with built-in pdb debugger. While I tried to debug a python script with "run -d script.py" within ipython shell, I got bellow error:
AttributeError: Pdb instance has no attribute 'curframe'

To debug script in ipython, we need to use a different debugger, pydb, for example. There are only three steps to setup and use it.
  1. download and install pydb.
  2. start ipython with -pydb argument: ipython -pydb
  3. start debugging with: run -d script.py
It's mandatory to set HOME environment variable to use pydb. On my windows box, there is no HOME environment variable set by default, and I got bellow error:
KeyError: 'HOME'
It can be solved by adding HOME environment variable.

Because pydb use the same set of commands with gdb, it's fairly straightforward to get start with it if you have done some debugging in gdb. This is one reason why I pick it as my debugger.

Reference:
Introducing the pydb Debugger
Debugging in Python

Kamis

logging with osip

As I posted before, logging is an important debugging means. In order to be truly useful and convenient, the logging module should at lease have two traits:
  1. can be turned on and off globally
  2. supports the concept of logging level
osip also comes with a mature logging system. Besides the traits I just mentioned, it also enables we  to configure log output destination, which can be a plain file, syslog, or a function pointer to a custom logging function. The function pointer enables us to save the log to any possible storage we prefer, e.g., across network.
There is a tiny bug which prevents us using the function pointer mechanism on windows platform if we compile the osip as dynamic library. The author forgot export osip_trace_initialize_func in osipparser2.def file. So our application will end in unresolved external symbol error if we use this function. To get around this, I added the line at the very end of osipparser2.def:
  osip_trace_initialize_func        @416


To use osip logging, we need to:
  1. Compile osip with ENABLE_TRACE macro defined
  2. Define ENABLE_TRACE in our application
  3. Initialize osip logging module
  4. Write log message with:  OSIP_TRACE (osip_trace(__FILE__, __LINE__, OSIP_INFO1, NULL, "log message"));
The wonderful thing is we can easily turn off logging by either undefine ENABLE_TRACE macro, or eliminate the line that initialize osip logging module. We can also trun logging message with specific logging level on and off. Very convenient.

An example is available here:
http://code.google.com/p/rxwen-blog-stuff/source/browse/trunk/protocol/osip_logging/osip_log.cpp

Rabu

windbg sos.dll version issue

I debugged a .net 1.1 based windows application which exits silently upon start up. The problem itself is trivial and not worth mentioning. What I want to say is there is a subtle point about sos.dll version.

When I was debugging, I started the application under windbg. Then issue ".loadby sos mscorwks" command to load sos.dll extension corresponds to the running .net framework. And I entered !DumpAllExceptions command which should exist in sos.dll for .net framework 1.1, but ended in not finding this command:
   No export DumpAllExceptions found
Finally, I had to use "!DumpHeap -type Exception" to find out all exceptions.

Having done some investigation, I found there are two sos.dll files for .net 1.1. One in .net framework installation folder, and one in windbg installation folder. The latter one is a full featured extension and support DumpAllExceptions command.
I tried debugging the application again with sos.dll comes with windbg by issusing: ".load windbg_installation_folder/clr10/sos.dll". This time, DumpAllExceptions was back to life and worked like a charm.
BTW, an alternative way to do !DumpAllExceptions is to take advantage of .foreach command.
   .foreach(exception {!DumpHeap -type Exception -short}) {!do exception; .echo print exception done !!! *****************}

For convenience, below are commands supported by different version sos.dll.


C:\WINDOWS\Microsoft.NET\Framework\v1.1.4322\SOS.dll
0:000> !help
SOS : Help
COMState             | List COM state for each thread
ClrStack             | Provides true managed stack trace, source and line numbers.
                       Additional parameters: -p[arams] -l[ocals] -r[egs] -a[ll].
DumpClass      | Dump EEClass info
DumpDomain []  | List assemblies and modules in a domain
DumpHeap [-stat] [-min 100] [-max 2000] [-mt 0x3000000] [-type ] [-fix] [start [end]] | Dump GC heap contents
DumpMD         | Dump MethodDesc info
DumpMT [-MD]   | Dump MethodTable info
DumpModule     | Dump EE Module info
DumpObj        | Dump an object on GC heap
DumpStack [-EE] [-smart] [top stack [bottom stack] | -EE only shows managed stack items.
DumpStackObjects [top stack [bottom stack]
DumpVC    | Dump a value class object
EEHeap [-gc] [-win32] [-loader] | List GC/Loader heap info
EEStack [-short] [-EE] | List all stacks EE knows
EEVersion            | List mscoree.dll version
FinalizeQueue [-detail]     | Work queue for finalize thread
GCInfo [] [IP]   | Dump GC encoding info for a managed method
GCRoot         | Find roots on stack/handle for object
IP2MD          | Find MethodDesc from IP
Name2EE | Find memory address of EE data given a class/method name
ObjSize []     | Find number of bytes that a root or all roots keep alive on GC heap.
ProcInfo [-env] [-time] [-mem] | Display the process info
RWLock [-all] | List info for a Read/Write lock
SyncBlk [-all|#]     | List syncblock
ThreadPool           | Display CLR threadpool state
Threads              | List managed threads
Token2EE  | Find memory address of EE data for metadata token
u [] [IP]        | Unassembly a managed code


{windbg installation folder}\clr10\sos.dll

0:000> !help
Did you know that a lot of exceptions (!dumpallexceptions) can cause memory problems. To see more tips, run !tip.
-------------------------------------------------------------------------------
SOS is a debugger extension DLL designed to aid in the debugging of managed
programs. Functions are listed by category, then roughly in order of
importance. Shortcut names for popular functions are listed in parenthesis.
Type "!help " for detailed info on that function.

Object Inspection                  Examining code and stacks
-----------------------------      -----------------------------
DumpObj (do)                       Threads (t)
DumpAllExceptions (dae)            CLRStack
DumpStackObjects (dso)             IP2MD
DumpHeap (dh)                      U
DumpVC                             DumpStack
GCRoot                             EEStack
ObjSize                            GCInfo
FinalizeQueue                      COMState
DumpDynamicAssemblies (dda)        X
DumpField (df)                     SearchStack
TraverseHeap (th)
GCRef

Examining CLR data structures      Diagnostic Utilities
-----------------------------      -----------------------------
DumpDomain                         VerifyHeap (vh)
EEHeap                             DumpLog
Name2EE                            FindAppDomain
SyncBlk                            SaveModule
DumpASPNETCache (dac)              SaveAllModules (sam)
DumpMT                             GCHandles
DumpClass                          GCHandleLeaks
DumpMD                             FindDebugTrue
Token2EE                           FindDebugModules
EEVersion                          Bp
DumpSig                            ProcInfo
DumpModule                         StopOnException (soe)
ThreadPool (tp)                    TD
ConvertTicksToDate (ctd)           Analysis
ConvertVTDateToDate (cvtdd)        Bl
RWLock                             CheckCurrentException (cce)
DumpConfig                         CurrentExceptionName (cen)
DumpHttpRuntime                    ExceptionBp
DumpSessionStateConfig             FindTable
DumpBuckets                        LoadCache
DumpHistoryTable                   SaveCache
DumpRequestTable                   ASPXPages
DumpCollection (dc)                DumpGCNotInProgress
DumpDataTables                     CLRUsage
GetWorkItems                                               
DumpLargeObjectSegments (dl)    
DumpModule
DumpAssembly                       Other
DumpMethodSig                      -----------------------------
DumpRuntimeTypes                   FAQ
PrintIPAddress
DumpHttpContext
DumpXmlDocument (dxd)


C:\WINDOWS\Microsoft.NET\Framework\v2.0.50727\SOS.dll
0:000> !help
-------------------------------------------------------------------------------
SOS is a debugger extension DLL designed to aid in the debugging of managed
programs. Functions are listed by category, then roughly in order of
importance. Shortcut names for popular functions are listed in parenthesis.
Type "!help " for detailed info on that function.

Object Inspection                  Examining code and stacks
-----------------------------      -----------------------------
DumpObj (do)                       Threads
DumpArray (da)                     CLRStack
DumpStackObjects (dso)             IP2MD
DumpHeap                           U
DumpVC                             DumpStack
GCRoot                             EEStack
ObjSize                            GCInfo
FinalizeQueue                      EHInfo
PrintException (pe)                COMState
TraverseHeap                       BPMD

Examining CLR data structures      Diagnostic Utilities
-----------------------------      -----------------------------
DumpDomain                         VerifyHeap
EEHeap                             DumpLog
Name2EE                            FindAppDomain
SyncBlk                            SaveModule
DumpMT                             GCHandles
DumpClass                          GCHandleLeaks
DumpMD                             VMMap
Token2EE                           VMStat
EEVersion                          ProcInfo
DumpModule                         StopOnException (soe)
ThreadPool                         MinidumpMode
DumpAssembly                     
DumpMethodSig                      Other
DumpRuntimeTypes                   -----------------------------
DumpSig                            FAQ
RCWCleanupList
DumpIL

Minggu

Trace System Calls

Sometimes, it's helpful to trace system api calls during debugging so that we can determine if the incorrect behavior is caused by passing wrong argument to a function or not. Or we can try to identify the performance bottleneck with it. There are several tools to use with this purpose.
For demonstration purpose, we'll use code below to try these tools
 1 #include    "Windows.h" / "unistd.h"
 2 #include    "fstream"
 3 using namespace std;
 4 
 5 void foo()
 6 {
 7     Sleep(2000); // windows
 8     sleep(2); // linux
 9 }
10 
11 void bar()
12 {
13     ofstream of("foo.dat");
14     char buf[] = {12345678910111213141516};
15     of << buf;
16     of.close();
17 
18     foo();
19 }
20 
21 int main()
22 {
23     bar();
24     foo();
25     return 0;
26 }
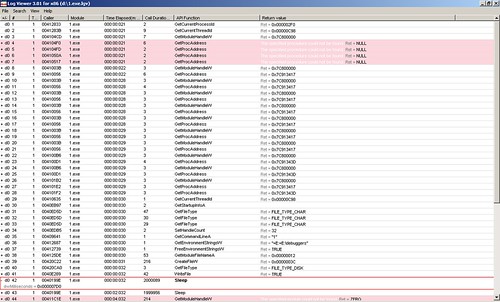
1. Logger This tool can be used as a standalone application or used as a debugger extension in windbg. It's capable of keeps records of all system api calls and corresponding parameters, return value, time spent, calling module and thread. To run as a application, simply call "logger.exe application to be traced". Then you can specify some option and filter in the window popped up. But standalone logger application isn't suitable for tracing windows service. In this case, we can attach windbg to a target process and load logexts extension to work against a service.
The result of logger is saved in a binary file placed in LogExts folder, and the file need to be opened in LogViewer. The file only records all APIs being called based on their orders, so we can't identify calling relationships between them. The figure belows shows the result of tracing ProcessAndThreads and ioFunctions module: From the row #42 which is expanded, we can see the parameter passed to Sleep function is 0x000007d0 which is 2000 in decimal.

2. wt command in windbg windbg has another powerful command wt. Compared with logger extension, it has more controls over which apis shall be traced. Actually, it can also trace user's function call. And the wonderful thing with it is it can show the calling relationship with a tree. It should be a preferable way. To use it, we set a break point in the place of interest. Then issue wt command. The debugee shall continue executing until this function returns. We perform wt on the sample code, the output is:
0:000> wt -l 4
Tracing 1!main to return address 004096a1
3 0 [ 0] 1!main
1 0 [ 1] 1!ILT+540(?barYAXXZ)
12 0 [ 1] 1!bar
...
37 1069 [ 1] 1!bar
1 0 [ 2] 1!ILT+735(?fooYAXXZ)
4 0 [ 2] 1!foo
6 0 [ 3] kernel32!Sleep
37 0 [ 4] kernel32!SleepEx
8 37 [ 3] kernel32!Sleep
6 45 [ 2] 1!foo
39 1121 [ 1] 1!bar
...
42 1209 [ 1] 1!bar
3 0 [ 2] 1!__security_check_cookie
45 1212 [ 1] 1!bar
4 1258 [ 0] 1!main
1 0 [ 1] 1!ILT+735(?fooYAXXZ)
4 0 [ 1] 1!foo
6 0 [ 2] kernel32!Sleep
3 0 [ 3] kernel32!SleepEx
19 0 [ 4] kernel32!_SEH_prolog
15 19 [ 3] kernel32!SleepEx
20 0 [ 4] ntdll!RtlActivateActivationContextUnsafeFast
20 39 [ 3] kernel32!SleepEx
19 0 [ 4] kernel32!BaseFormatTimeOut
26 58 [ 3] kernel32!SleepEx
1 0 [ 4] ntdll!ZwDelayExecution
3 0 [ 4] ntdll!NtDelayExecution
31 62 [ 3] kernel32!SleepEx
4 0 [ 4] kernel32!SleepEx
36 66 [ 3] kernel32!SleepEx
9 0 [ 4] kernel32!_SEH_epilog
37 75 [ 3] kernel32!SleepEx
8 112 [ 2] kernel32!Sleep
6 120 [ 1] 1!foo
7 1385 [ 0] 1!main

1392 instructions were executed in 1391 events (0 from other threads)

Function Name Invocations MinInst MaxInst AvgInst
1!ILT+1010(??0?$basic_ofstreamDU?$char_traitsDs 1 1 1 1
1!ILT+1040(?sputn?$basic_streambufDU?$char_trai 1 1 1 1
1!ILT+1060(?close?$basic_ofstreamDU?$char_trait 1 1 1 1
1!ILT+1090(??0sentry?$basic_ostreamDU?$char_tra 1 1 1 1
1!ILT+1125(?flagsios_basestdQBEHXZ) 1 1 1 1
1!ILT+1155(?getloc?$basic_streambufDU?$char_tra 1 1 1 1
1!ILT+1185(??0_Sentry_base?$basic_ostreamDU?$ch 1 1 1 1
1!ILT+1210(?_Osfx?$basic_ostreamDU?$char_traits 1 1 1 1
1!ILT+130(??1localestdQAEXZ) 1 1 1 1
...
1!ILT+950(??0?$basic_streambufDU?$char_traitsDs 1 1 1 1
1!ILT+965(??1?$basic_ofstreamDU?$char_traitsDst 1 1 1 1
1!__security_check_cookie 1 3 3 3
1!__uncaught_exception 1 6 6 6
1!bar 1 45 45 45
1!fclose 1 27 27 27
1!foo 2 6 6 6
1!main 1 7 7 7
1!std::_Fiopen 1 29 29 29
...
1!strlen 1 52 52 52
kernel32!BaseFormatTimeOut 1 19 19 19
kernel32!Sleep 2 8 8 8
kernel32!SleepEx 3 4 37 26
kernel32!_SEH_epilog 1 9 9 9
kernel32!_SEH_prolog 1 19 19 19
ntdll!NtDelayExecution 1 3 3 3
ntdll!RtlActivateActivationContextUnsafeFast 1 20 20 20
ntdll!ZwDelayExecution 1 1 1 1

0 system calls were executed

eax=00000000 ebx=7ffd6000 ecx=7c80240f edx=7c90e514 esi=00dcf766 edi=00dcf6f2
eip=004096a1 esp=0012ff80 ebp=0012ffc0 iopl=0 nv up ei pl zr na pe nc
cs=001b ss=0023 ds=0023 es=0023 fs=003b gs=0000 efl=00000246
1!__tmainCRTStartup+0xfb:
0

3. strace on linux strace is similar to logger on windows in that it only trace api calls in a flat structure.

Selasa

Design for debugging

After we release a product to market, it's not uncommon that our customer report bugs to us, even we gained a lot of confidence from "thorough" tests by ourselves and QA guys. If it occurs, we usually don't have the luxury to perform debugging in production environment with a debugger. So, it's important we design in advance to help us debugging in this situation.
I read from Darin Dillon's Debugging Strategies for .NET Developers that they always have several testing boxes to run released products. And it's strictly prohibited to install any development tools on them. It seems to be an extreme stern rule and hurt debugging efficiency. But I think it's a beneficial rule for producing a great product. This way, we developers are forced to think about how to make debugging easier in this situation which may occur frequently on customers' sites.
Take microsoft's windows for example, there are plenty of ways to assist debugging in released version. Such as dr.watson for collecting dump file, error reporting mechanism, system event log, etc. Engineers at MS are doing their best to collect as much information as possible when unexpected behavior occurs. You can hardly imagine is one of your application crashes and the tech support guy from MS asked you to assist him attaching a remote debugger to your machine. Neither will we be able to.

Means:
1. Logging
It's no doubt logging will be the first one jumping into our head. Logging is a good way on customer's site since it doesn't require the customer to install any additional software to enable it. While using this feature, we must always be cautious not to simply use printf or Debug.WriteLine otherwise we'll easily be overwhelmed by a mess of log flood.
A not-bad logging system should at least be able to or have: toggle on/off, consistent style and proper layout. It's better to have the ability to set logging level to avoid log flood when possible. Preferably, we can choose a mature logging library such as log4net.
An important requirement is that the logging system could be configured without recompilation. The best way is it can even be toggled at runtime without restarting the application. DbgView is a great tool can achieve so. (Ken.Zhang explained its work mechanism in this article.)

2. Dump file
Log file has the advantage of keeping record of what's happening as time goes by, but you can only see part of information that you explicitly output. Dump file is a copy of a process on customer's site that you can examine on your developing machine to view other information missing in log. But it's a static image of the process at a fixed time. Usually, it also doesn't require install a specific software to generate dump file. Core dump on linux and Dr. Watson on windows are supported by a naked OS installation.
If we need to perform some customizations on these tools, we'd better provide a friendly GUI tool to the customer so that a average user can use.

3. Source control tag
After we released a product, it's important we keep a record of the source control system version tag correlates to the release. It's mandatory that we examine the correct code to hunt for a bug. It's not possible that we commit new code to repository after the product has been released and the most recent code doesn't match the product release. How disappointed will we be if we seem to get some clue for a bug but are not able to retrieve the correct code. So, it's important for us to find out the source control system version tag for any release.
BTW, on windows, it's also important to keep a copy of related symbol file for each release. Refer to: PDB Files: What Every Developer Must Know by John Robbins

4. Information collector
The product should have at least passed testing in the development department. So we usually need to focus on the difference between the customer's environment and our own. Those difference are very likely to be the culprit. msinfo32.exe is a good candidate for this goal.

Kamis

Use trace point in windbg

In visual studio, we can add trace point while debugging. It's a helpful feature to analyze the behavior of a program without breaking the execution of the target process. Isn't it useful if you debug a multi-thread process?
At first glance, it seems to be just an alternative for System.Diagnostics.Debug.WriteLine. But we don't have to write these code anymore. Say if we want to examine the behavior at some point that we didn't use WriteLine, use trace point, we don't need to stop the process, modify code, compile and run again. Just attach the visual studio to the process, set a break point and change it to trace point. It's done.
What about on-site debugging? It's common that we use windbg in this scenario. We can also take advantage of similar feature in windbg. When set a break point in windbg, you can also specify a command string that will be executed automatically while the break point is hit. The command string can be composed of several statements that will be executed in sequence.

Here is a sample code, suppose we want to trace when and where foo is invoked:
#include "Windows.h"

void foo()
{
Sleep(2000);
}

int main()
{
while(true)
foo();
return 0;
}

Then we compile and execute the code. Now attach the windbg to the target and add a break point with:
bp foo ".echo enter foo;k;g;"

Note that we need at least public symbol file to debug this.
Every time foo is invoked, following output will be printed in the debugger. And the process continues.
enter foo
ChildEBP RetAddr
0012ff54 004010d3 1!foo [d:\documents and settings\raymond\desktop\dbg\1.cpp @ 35]
0012ff78 0040138c 1!main+0x53 [d:\documents and settings\raymond\desktop\dbg\1.cpp @ 45]
0012ffc0 7c816fe7 1!__tmainCRTStartup+0xfb [f:\dd\vctools\crt_bld\self_x86\crt\src\crt0.c @ 266]
0012fff0 00000000 kernel32!BaseProcessStart+0x23

Let's explain the preceding command string. It composes of three statements. First, echo a string saying we enter the foo function. Then, print the call stack with k command. Finally, use g command to continue the process.

Jumat

GoAhead Web Server Hang

Symptom:
Recently, we are experiencing process hang with the goAhead web server. The symptom can be reproduced if we disconnect the network cable while the browser is loading a page. When it occurs, we can see that the process doesn't occupy any cpu resource with top command. And we can see there are a lot of connections in ESTABLISHED, CLOSE_WAIT, TIME_WAIT, FIN_WAIT status with netsstat -atn command.
Ayalysis:
From the symptom we observed, there is no doubt it's caused by process hang. Usually, process hang is caused by the process being waiting on some conditions never or take an extreme long time to to satisfy. A typical scenario is dead lock.
We adopted a method that is kind of naive but straightforward to investigate the cause, which is printf. We inserted a lot of printf statement into source code to find out exactly in which method did the web server hanged. This is time consuming but yet effective. By time consuming, we spend more than two days on finding out the calling sequence. By effective, we finally find out that the web server is hanging in network operation.
Aside: It does seems inefficient to do so. Actually, we've tried to attach a debugger to the hung process with gdbserver(cmd: gdbserver --attach IPADDRESS:PORT PID). But in the debugger, it seems to be missing correct symbol information. And even the thread information (cmd: info threads) isn't correct. These information are correct if we attach the debugger to the web server when it's not hung.
The real cause is when the peer of the socket is forcibly disconnected even without sending FIN. So the web server still considers the socket in ESTABLISHED state. Then it will operate on the socket as normal. If the socket is in Blocking mode and doesn't have a timeout specified, the web server will be blocked on reading from or writting to the socket indefinitely.
Solution:
Having found out the cause, it's easy to solve it. We can either specify a timeout on the native socket or set the socket to non-blocking mode. Code below demonstrates how to achieve so.

1. Specify timeout
void websSSLReadEvent(webs_t wp)
{
sptr = socketPrt(wp->sid);
struct timeval tv;
tv.tv_sec = 2; // timeout is two seconds
tv.tv_usec = 0; // it must be set to 0 explicitly, otherwise it may be a random number
int rc = setsockopt(sptr->sock, SOL_SOCKET, SO_RCVTIMEO, (struct timeval*)&tv, sizeof(struct timeval));
rc = setsockopt(sptr->sock, SOL_SOCKET, SO_SNDTIMEO, (struct timeval*)&tv, sizeof(struct timeval));
....
}

2. Clear Blocking mode
void websDone(webs_t wp)
{
....
socketSetBlock(wp->sid, 0); // the second parameter is one originally. so that it will flush everything to the peer in blocking mode to achieve graceful closing
socketFlush(wp->sid);
}

Detect Stack Corruption

Stack corruption bug is sometimes difficult to fix if we can't find out the steps to reproduce it. The cause of the bug may not be so obvious. The best thing is to have the culprit reveal itself as soon as possible, even before the stack corrupted. In this post, I'll introduce the tool to help discover stack corruption.

Rationale:
The figure below shows the structure of stack frame.It's important to know that stack grows downwards. The callee's frame is at lower position relative to caller's frame, and the callee's local variables are at lower position relative to return address. So, if our code carelessly write to a local variable beyond its boundary, the saved %ebp and return address may be corrupted. The appication may continue running until the callee returns or even later and then crash.
This is a sample code demonstrates this:


1 int foo(int a)

2 {

3 char var[4];

4 strcpy(var, "corrupt me!!!");

5 int a, b;

6 a = a + b;

7 return 0;

8 }

9

10 int bar()

11 {

12 return foo();

13 }


It's not hard to see that the saved %ebp should always stay unchanged during the execution of the callee since it will be used on return to restore the caller's %ebp.
So we can:
  1. Save the saved %ebp value at the beginning of the callee;
  2. Get the saved %ebp value before the callee returns;
  3. Compare these two value to see if they are the same;
Implementation:
The saved %ebp is the value of the memory that %ebp register is pointing to. In order to get its value, we need to use assembly language. But it's not difficult, it usually doesn't take more than one instruction to achieve. Here is the one for GCC on x86 platform.
asm("mov (%%ebp),%0": "=r" (variable for storing ebp's value));

Armed with this knowledge, we have the macro below to help detecting stack corruption.


1 #ifndef _h_DBGHELPER

2 #define _h_DBGHELPER

3

4

5 #include <assert.h>

6

7

8 #define STACKCHECK

9 #ifdef STACKCHECK // stack check enabled

10

11 #define STACK_CHECK_RAND 0xCD000000

12 #define STACK_CHECK_MASK 0x00FFFFFF

13

14 // the internal logic of checking stack state

15 #define STACK_CHECK_END_INTERNAL() u_STACK_CHECK_EBP_VALUE_RETURN = ((u_STACK_CHECK_EBP_VALUE_RETURN & STACK_CHECK_MASK)\

16 | STACK_CHECK_RAND);\

17 if((u_STACK_CHECK_EBP_VALUE_ENTER & ~STACK_CHECK_MASK) != STACK_CHECK_RAND)\

18 {\

19 fprintf(stderr, \

20 "Corrupted u_STACK_CHECK_EBP_VALUE_ENTER!! It's %x\n", u_STACK_CHECK_EBP_VALUE_ENTER);\

21 assert((u_STACK_CHECK_EBP_VALUE_ENTER & ~STACK_CHECK_MASK) == STACK_CHECK_RAND);\

22 }\

23 if((u_STACK_CHECK_EBP_VALUE_RETURN & ~STACK_CHECK_MASK) != STACK_CHECK_RAND)\

24 {\

25 fprintf(stderr, \

26 "Corrupted u_STACK_CHECK_EBP_VALUE_RETURN!! It's %x\n", u_STACK_CHECK_EBP_VALUE_RETURN);\

27 assert((u_STACK_CHECK_EBP_VALUE_RETURN & ~STACK_CHECK_MASK) == STACK_CHECK_RAND);\

28 }\

29 if(u_STACK_CHECK_EBP_VALUE_ENTER != u_STACK_CHECK_EBP_VALUE_RETURN)\

30 {\

31 fprintf(stderr, "Stack overflow!!!\nThe EBP should be %x, but it's %x( %s )\n\n",\

32 u_STACK_CHECK_EBP_VALUE_ENTER, u_STACK_CHECK_EBP_VALUE_RETURN, \

33 (char*)&u_STACK_CHECK_EBP_VALUE_RETURN);\

34 assert(u_STACK_CHECK_EBP_VALUE_RETURN == u_STACK_CHECK_EBP_VALUE_ENTER);\

35 }

36 // end

37

38 #ifndef ARM_9260EK // x86

39 #define STACK_CHECK_BEGIN() unsigned int u_STACK_CHECK_EBP_VALUE_ENTER = 0; \

40 asm("mov (%%ebp),%0"\

41 : "=r" (u_STACK_CHECK_EBP_VALUE_ENTER));\

42 u_STACK_CHECK_EBP_VALUE_ENTER = (u_STACK_CHECK_EBP_VALUE_ENTER & STACK_CHECK_MASK) | STACK_CHECK_RAND

43

44 #define STACK_CHECK_END() do{unsigned int u_STACK_CHECK_EBP_VALUE_RETURN = 0;\

45 asm("mov (%%ebp),%0"\

46 : "=r" (u_STACK_CHECK_EBP_VALUE_RETURN));\

47 STACK_CHECK_END_INTERNAL();}while(0)

48

49

50 #else // arm

51 #define STACK_CHECK_BEGIN() unsigned int u_STACK_CHECK_EBP_VALUE_ENTER = 0; \

52 asm("str fp, %0 \n" \

53 : "=m" (u_STACK_CHECK_EBP_VALUE_ENTER)); \

54 u_STACK_CHECK_EBP_VALUE_ENTER = (u_STACK_CHECK_EBP_VALUE_ENTER & STACK_CHECK_MASK) | STACK_CHECK_RAND

55

56 #define STACK_CHECK_END() do{unsigned int u_STACK_CHECK_EBP_VALUE_RETURN = 0;\

57 asm("str fp, %0 \n" \

58 : "=m" (u_STACK_CHECK_EBP_VALUE_RETURN));\

59 STACK_CHECK_END_INTERNAL();}while(0)

60

61 #endif

62

63

64 #else // STACK Check disabled

65

66 #define STACK_CHECK_BEGIN() do{}while(0)

67 #define STACK_CHECK_END() do{}while(0)

68

69 #endif

70

71 #endif // _h_DBGHELPER


The basic idea of the macro is pretty much the same as I mentioned before. One thing to note is the variables used to keep the value of %ebp register are defined on the stack too. So they are on the current frame and may be corrupted too. In order to avoid this, we have several options. First, we can define them as static so that they will be in global data region rather than stack. But it will be unusable in mutl-threading environment. Second, we can define them on heap. Third, we can use a predefined random value to guard these variables and make sure they're not overwritten.
The third option is the one we used here.

Usage:
We can update previous code to take advantage of this feature as follows:

1 int foo(int a)

2 {

3 STACK_CHECK_BEGIN();

4 char var[4];

5 strcpy(var, "corrupt me!!!");

6 int a, b;

7 a = a + b;

8 STACK_CHECK_END();

9 return 0;

10 }

11

12 int bar()

13 {

14 return foo();

15 }


The application will gracefully assert that it detects a stack corruption just before the foo() method returns.


Microsoft's c++ compiler
and gcc have already provide stack checking functions. But I still think the macro is convenient and my effort has greatly consolidated my understanding of stack structure.

References:

http://blogs.msdn.com/vcblog/archive/2009/03/19/gs.aspx