I read from Tomas's post that newer version windbg can't be downloaded from microsoft directly anymore. To get newer windbg, we have to download the huge 620 mb WDK iso and extract windbg installer from it manually. The newest windbg standalone installer is version 6.11.1.404, released on March 27, 2009.
I don't know if microsoft will listen to our customer's voice and release a standalone windbg. Before they will, for the convenience for developers like me, here is extracted windbg package:
windbg 6.12.0002.633 x86 http://rxwen-blog-stuff.googlecode.com/files/windbg_6.12.0002.633_x86.zip
md5sum: abdad1a805f7d89d461b4569b216001d
sha1sum: 3715d726363524643a6df561bf9d27e7acb49307
windbg_6.12.0002.633_64_installer http://rxwen-blog-stuff.googlecode.com/files/windbg_6.12.0002.633_64_installer.zip
md5sum: 62fc3d313081f96fea3f69c4d06700a1
sha1sum: d79e6f40c08a95d5653c0eb0cc7d64c8bea8e391
A noticable change of this version is: ADPlus V7.0 is a total rewrite of ADPlus. ADPlus is now written in managed code which will allow us to add new features much easier. The old version is renamed to adplus_old.vbs. This page lists more changes of the new version.
Hope it helps.
Tampilkan postingan dengan label windbg. Tampilkan semua postingan
Tampilkan postingan dengan label windbg. Tampilkan semua postingan
Rabu
windbg sos.dll version issue
| I debugged a .net 1.1 based windows application which exits silently upon start up. The problem itself is trivial and not worth mentioning. What I want to say is there is a subtle point about sos.dll version. When I was debugging, I started the application under windbg. Then issue ".loadby sos mscorwks" command to load sos.dll extension corresponds to the running .net framework. And I entered !DumpAllExceptions command which should exist in sos.dll for .net framework 1.1, but ended in not finding this command: No export DumpAllExceptions found Finally, I had to use "!DumpHeap -type Exception" to find out all exceptions. Having done some investigation, I found there are two sos.dll files for .net 1.1. One in .net framework installation folder, and one in windbg installation folder. The latter one is a full featured extension and support DumpAllExceptions command. I tried debugging the application again with sos.dll comes with windbg by issusing: ".load windbg_installation_folder/clr10/sos.dll". This time, DumpAllExceptions was back to life and worked like a charm. BTW, an alternative way to do !DumpAllExceptions is to take advantage of .foreach command. .foreach(exception {!DumpHeap -type Exception -short}) {!do exception; .echo print exception done !!! *****************} For convenience, below are commands supported by different version sos.dll. C:\WINDOWS\Microsoft.NET\Framework\v1.1.4322\SOS.dll 0:000> !help SOS : Help COMState | List COM state for each thread ClrStack | Provides true managed stack trace, source and line numbers. Additional parameters: -p[arams] -l[ocals] -r[egs] -a[ll]. DumpClass DumpDomain [ DumpHeap [-stat] [-min 100] [-max 2000] [-mt 0x3000000] [-type DumpMD DumpMT [-MD] DumpModule DumpObj DumpStack [-EE] [-smart] [top stack [bottom stack] | -EE only shows managed stack items. DumpStackObjects [top stack [bottom stack] DumpVC EEHeap [-gc] [-win32] [-loader] | List GC/Loader heap info EEStack [-short] [-EE] | List all stacks EE knows EEVersion | List mscoree.dll version FinalizeQueue [-detail] | Work queue for finalize thread GCInfo [ GCRoot IP2MD Name2EE ObjSize [ ProcInfo [-env] [-time] [-mem] | Display the process info RWLock [-all] SyncBlk [-all|#] | List syncblock ThreadPool | Display CLR threadpool state Threads | List managed threads Token2EE u [ {windbg installation folder}\clr10\sos.dll 0:000> !help Did you know that a lot of exceptions (!dumpallexceptions) can cause memory problems. To see more tips, run !tip. ------------------------------------------------------------------------------- SOS is a debugger extension DLL designed to aid in the debugging of managed programs. Functions are listed by category, then roughly in order of importance. Shortcut names for popular functions are listed in parenthesis. Type "!help Object Inspection Examining code and stacks ----------------------------- ----------------------------- DumpObj (do) Threads (t) DumpAllExceptions (dae) CLRStack DumpStackObjects (dso) IP2MD DumpHeap (dh) U DumpVC DumpStack GCRoot EEStack ObjSize GCInfo FinalizeQueue COMState DumpDynamicAssemblies (dda) X DumpField (df) SearchStack TraverseHeap (th) GCRef Examining CLR data structures Diagnostic Utilities ----------------------------- ----------------------------- DumpDomain VerifyHeap (vh) EEHeap DumpLog Name2EE FindAppDomain SyncBlk SaveModule DumpASPNETCache (dac) SaveAllModules (sam) DumpMT GCHandles DumpClass GCHandleLeaks DumpMD FindDebugTrue Token2EE FindDebugModules EEVersion Bp DumpSig ProcInfo DumpModule StopOnException (soe) ThreadPool (tp) TD ConvertTicksToDate (ctd) Analysis ConvertVTDateToDate (cvtdd) Bl RWLock CheckCurrentException (cce) DumpConfig CurrentExceptionName (cen) DumpHttpRuntime ExceptionBp DumpSessionStateConfig FindTable DumpBuckets LoadCache DumpHistoryTable SaveCache DumpRequestTable ASPXPages DumpCollection (dc) DumpGCNotInProgress DumpDataTables CLRUsage GetWorkItems DumpLargeObjectSegments (dl) DumpModule DumpAssembly Other DumpMethodSig ----------------------------- DumpRuntimeTypes FAQ PrintIPAddress DumpHttpContext DumpXmlDocument (dxd) C:\WINDOWS\Microsoft.NET\Framework\v2.0.50727\SOS.dll 0:000> !help ------------------------------------------------------------------------------- SOS is a debugger extension DLL designed to aid in the debugging of managed programs. Functions are listed by category, then roughly in order of importance. Shortcut names for popular functions are listed in parenthesis. Type "!help Object Inspection Examining code and stacks ----------------------------- ----------------------------- DumpObj (do) Threads DumpArray (da) CLRStack DumpStackObjects (dso) IP2MD DumpHeap U DumpVC DumpStack GCRoot EEStack ObjSize GCInfo FinalizeQueue EHInfo PrintException (pe) COMState TraverseHeap BPMD Examining CLR data structures Diagnostic Utilities ----------------------------- ----------------------------- DumpDomain VerifyHeap EEHeap DumpLog Name2EE FindAppDomain SyncBlk SaveModule DumpMT GCHandles DumpClass GCHandleLeaks DumpMD VMMap Token2EE VMStat EEVersion ProcInfo DumpModule StopOnException (soe) ThreadPool MinidumpMode DumpAssembly DumpMethodSig Other DumpRuntimeTypes ----------------------------- DumpSig FAQ RCWCleanupList DumpIL | |
Minggu
Trace System Calls
Sometimes, it's helpful to trace system api calls during debugging so that we can determine if the incorrect behavior is caused by passing wrong argument to a function or not. Or we can try to identify the performance bottleneck with it. There are several tools to use with this purpose.
For demonstration purpose, we'll use code below to try these tools
The result of logger is saved in a binary file placed in LogExts folder, and the file need to be opened in LogViewer. The file only records all APIs being called based on their orders, so we can't identify calling relationships between them. The figure belows shows the result of tracing ProcessAndThreads and ioFunctions module: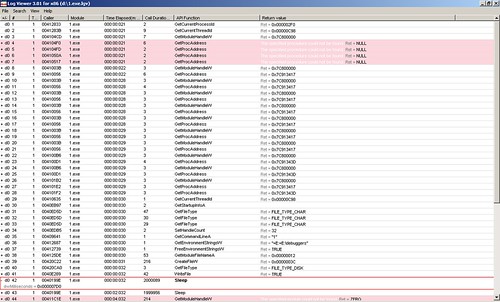 From the row #42 which is expanded, we can see the parameter passed to Sleep function is 0x000007d0 which is 2000 in decimal.
2. wt command in windbg windbg has another powerful command wt. Compared with logger extension, it has more controls over which apis shall be traced. Actually, it can also trace user's function call. And the wonderful thing with it is it can show the calling relationship with a tree. It should be a preferable way. To use it, we set a break point in the place of interest. Then issue wt command. The debugee shall continue executing until this function returns. We perform wt on the sample code, the output is:
For demonstration purpose, we'll use code below to try these tools
1 #include "Windows.h" / "unistd.h"
2 #include "fstream"
3 using namespace std;
4
5 void foo()
6 {
7 Sleep(2000); // windows
8 sleep(2); // linux
9 }
10
11 void bar()
12 {
13 ofstream of("foo.dat");
14 char buf[] = {1, 2, 3, 4, 5, 6, 7, 8, 9, 10, 11, 12, 13, 14, 15, 16};
15 of << buf;
16 of.close();
17
18 foo();
19 }
20
21 int main()
22 {
23 bar();
24 foo();
25 return 0;
26 }
1. Logger This tool can be used as a standalone application or used as a debugger extension in windbg. It's capable of keeps records of all system api calls and corresponding parameters, return value, time spent, calling module and thread. To run as a application, simply call "logger.exe application to be traced". Then you can specify some option and filter in the window popped up. But standalone logger application isn't suitable for tracing windows service. In this case, we can attach windbg to a target process and load logexts extension to work against a service.2 #include "fstream"
3 using namespace std;
4
5 void foo()
6 {
7 Sleep(2000); // windows
8 sleep(2); // linux
9 }
10
11 void bar()
12 {
13 ofstream of("foo.dat");
14 char buf[] = {1, 2, 3, 4, 5, 6, 7, 8, 9, 10, 11, 12, 13, 14, 15, 16};
15 of << buf;
16 of.close();
17
18 foo();
19 }
20
21 int main()
22 {
23 bar();
24 foo();
25 return 0;
26 }
The result of logger is saved in a binary file placed in LogExts folder, and the file need to be opened in LogViewer. The file only records all APIs being called based on their orders, so we can't identify calling relationships between them. The figure belows shows the result of tracing ProcessAndThreads and ioFunctions module:
 From the row #42 which is expanded, we can see the parameter passed to Sleep function is 0x000007d0 which is 2000 in decimal.
2. wt command in windbg windbg has another powerful command wt. Compared with logger extension, it has more controls over which apis shall be traced. Actually, it can also trace user's function call. And the wonderful thing with it is it can show the calling relationship with a tree. It should be a preferable way. To use it, we set a break point in the place of interest. Then issue wt command. The debugee shall continue executing until this function returns. We perform wt on the sample code, the output is:
0:000> wt -l 43. strace on linux strace is similar to logger on windows in that it only trace api calls in a flat structure.
Tracing 1!main to return address 004096a1
3 0 [ 0] 1!main
1 0 [ 1] 1!ILT+540(?barYAXXZ)
12 0 [ 1] 1!bar
...
37 1069 [ 1] 1!bar
1 0 [ 2] 1!ILT+735(?fooYAXXZ)
4 0 [ 2] 1!foo
6 0 [ 3] kernel32!Sleep
37 0 [ 4] kernel32!SleepEx
8 37 [ 3] kernel32!Sleep
6 45 [ 2] 1!foo
39 1121 [ 1] 1!bar
...
42 1209 [ 1] 1!bar
3 0 [ 2] 1!__security_check_cookie
45 1212 [ 1] 1!bar
4 1258 [ 0] 1!main
1 0 [ 1] 1!ILT+735(?fooYAXXZ)
4 0 [ 1] 1!foo
6 0 [ 2] kernel32!Sleep
3 0 [ 3] kernel32!SleepEx
19 0 [ 4] kernel32!_SEH_prolog
15 19 [ 3] kernel32!SleepEx
20 0 [ 4] ntdll!RtlActivateActivationContextUnsafeFast
20 39 [ 3] kernel32!SleepEx
19 0 [ 4] kernel32!BaseFormatTimeOut
26 58 [ 3] kernel32!SleepEx
1 0 [ 4] ntdll!ZwDelayExecution
3 0 [ 4] ntdll!NtDelayExecution
31 62 [ 3] kernel32!SleepEx
4 0 [ 4] kernel32!SleepEx
36 66 [ 3] kernel32!SleepEx
9 0 [ 4] kernel32!_SEH_epilog
37 75 [ 3] kernel32!SleepEx
8 112 [ 2] kernel32!Sleep
6 120 [ 1] 1!foo
7 1385 [ 0] 1!main
1392 instructions were executed in 1391 events (0 from other threads)
Function Name Invocations MinInst MaxInst AvgInst
1!ILT+1010(??0?$basic_ofstreamDU?$char_traitsDs 1 1 1 1
1!ILT+1040(?sputn?$basic_streambufDU?$char_trai 1 1 1 1
1!ILT+1060(?close?$basic_ofstreamDU?$char_trait 1 1 1 1
1!ILT+1090(??0sentry?$basic_ostreamDU?$char_tra 1 1 1 1
1!ILT+1125(?flagsios_basestdQBEHXZ) 1 1 1 1
1!ILT+1155(?getloc?$basic_streambufDU?$char_tra 1 1 1 1
1!ILT+1185(??0_Sentry_base?$basic_ostreamDU?$ch 1 1 1 1
1!ILT+1210(?_Osfx?$basic_ostreamDU?$char_traits 1 1 1 1
1!ILT+130(??1localestdQAEXZ) 1 1 1 1
...
1!ILT+950(??0?$basic_streambufDU?$char_traitsDs 1 1 1 1
1!ILT+965(??1?$basic_ofstreamDU?$char_traitsDst 1 1 1 1
1!__security_check_cookie 1 3 3 3
1!__uncaught_exception 1 6 6 6
1!bar 1 45 45 45
1!fclose 1 27 27 27
1!foo 2 6 6 6
1!main 1 7 7 7
1!std::_Fiopen 1 29 29 29
...
1!strlen 1 52 52 52
kernel32!BaseFormatTimeOut 1 19 19 19
kernel32!Sleep 2 8 8 8
kernel32!SleepEx 3 4 37 26
kernel32!_SEH_epilog 1 9 9 9
kernel32!_SEH_prolog 1 19 19 19
ntdll!NtDelayExecution 1 3 3 3
ntdll!RtlActivateActivationContextUnsafeFast 1 20 20 20
ntdll!ZwDelayExecution 1 1 1 1
0 system calls were executed
eax=00000000 ebx=7ffd6000 ecx=7c80240f edx=7c90e514 esi=00dcf766 edi=00dcf6f2
eip=004096a1 esp=0012ff80 ebp=0012ffc0 iopl=0 nv up ei pl zr na pe nc
cs=001b ss=0023 ds=0023 es=0023 fs=003b gs=0000 efl=00000246
1!__tmainCRTStartup+0xfb:
0
Kamis
Use trace point in windbg
In visual studio, we can add trace point while debugging. It's a helpful feature to analyze the behavior of a program without breaking the execution of the target process. Isn't it useful if you debug a multi-thread process?
At first glance, it seems to be just an alternative for System.Diagnostics.Debug.WriteLine. But we don't have to write these code anymore. Say if we want to examine the behavior at some point that we didn't use WriteLine, use trace point, we don't need to stop the process, modify code, compile and run again. Just attach the visual studio to the process, set a break point and change it to trace point. It's done.
What about on-site debugging? It's common that we use windbg in this scenario. We can also take advantage of similar feature in windbg. When set a break point in windbg, you can also specify a command string that will be executed automatically while the break point is hit. The command string can be composed of several statements that will be executed in sequence.
Here is a sample code, suppose we want to trace when and where foo is invoked:
Then we compile and execute the code. Now attach the windbg to the target and add a break point with:
Note that we need at least public symbol file to debug this.
Every time foo is invoked, following output will be printed in the debugger. And the process continues.
Let's explain the preceding command string. It composes of three statements. First, echo a string saying we enter the foo function. Then, print the call stack with k command. Finally, use g command to continue the process.
At first glance, it seems to be just an alternative for System.Diagnostics.Debug.
What about on-site debugging? It's common that we use windbg in this scenario. We can also take advantage of similar feature in windbg. When set a break point in windbg, you can also specify a command string that will be executed automatically while the break point is hit. The command string can be composed of several statements that will be executed in sequence.
Here is a sample code, suppose we want to trace when and where foo is invoked:
#include "Windows.h"

void foo()
{
Sleep(2000);
}

int main()
{
while(true)
foo();
return 0;
}
Then we compile and execute the code. Now attach the windbg to the target and add a break point with:
bp foo ".echo enter foo;k;g;"Note that we need at least public symbol file to debug this.
Every time foo is invoked, following output will be printed in the debugger. And the process continues.
enter foo
ChildEBP RetAddr
0012ff54 004010d3 1!foo [d:\documents and settings\raymond\desktop\dbg\1.cpp @ 35]
0012ff78 0040138c 1!main+0x53 [d:\documents and settings\raymond\desktop\dbg\1.cpp @ 45]
0012ffc0 7c816fe7 1!__tmainCRTStartup+0xfb [f:\dd\vctools\crt_bld\self_x86\crt\src\crt0.c @ 266]
0012fff0 00000000 kernel32!BaseProcessStart+0x23
Let's explain the preceding command string. It composes of three statements. First, echo a string saying we enter the foo function. Then, print the call stack with k command. Finally, use g command to continue the process.
Senin
Minimize Code Explosion of Generic Type
Generic is added to .net framework since version 2, which highly increase the re-usability of commonly used algorithms. It's well known that jit compiler will generate concrete type with given generic type argument at run time. So, it's possible that there will be code explosion if a lot of concrete types are created.
What kind of explosion?
According to the compilation model of .net application. The C#/VB code is first compiled into IL code. Then the jit compiler will compile the IL code into native code on demand. The jit compiler will also generate concrete type with specified type arguments. So, there is only one copy of IL code with generic type argument still in place.
What get duplicated is the native code generated by jit compiler. There is a copy for every method for each concrete type.
Another kind of data has duplication is EEClass and MethodTable. EEClass and MethodTable is type specific data. Strictly speaking, such data don't get duplicated because they are unique to each concrete type.
How .net tries to avoid explosion
In .net framework, two methods are adopted to minimize code explosion.
1. Different invokes of a generic method with the same type argument share the same copy of native code. This only takes effect when these invokes are in the same appdomain.
2. The CLR considers all reference type arguments to be identical. It does this based on the fact that reference variables are pointers (kind of, not accurate expression) to object on the heap. They can be manipulated in the same way.
Verify the optimization
In order to verify that the optimization method acutally behaves that way, we create the following sample and debug it with windbg.
Input sxe ld:mscorlib to instruct windbg to break when the application loads mscorlib module
When windbg breaks, input .loadby sos mscorwks to load sos.dll
Input .chain to confirm the sos extension has been successfully loaded
Input !bpmd Test.exe Test.Program.Main to set a managed breakpoint in Main method
Input p command several times until we see System.Collections.Generic.List`1 object on the managed stack with !dso command. The output below shows objects we are interested in:
Input !do 01e6bc04 to dump the first object and we get:
Input !dumpmt -md 008126a4 to dump method table for this object. We get:
And we do the same thing to dump method table for the 2nd and 3rd object. The output is:
From the output, we can easily identify that the method for objList and delList are the same, but the method for intList is different. So we've verified that the code for concrete type of reference type argument are shared.
Although the code is shared, these objects' EEClass are different. So they are actually different types.
Given the debugging skill above, we can also easily verify that different generic instances defined with the same type argument in different scope have the same EEClass.
References:
Drill Into .NET Framework Internals to See How the CLR Creates Runtime Objects
What kind of explosion?
According to the compilation model of .net application. The C#/VB code is first compiled into IL code. Then the jit compiler will compile the IL code into native code on demand. The jit compiler will also generate concrete type with specified type arguments. So, there is only one copy of IL code with generic type argument still in place.
What get duplicated is the native code generated by jit compiler. There is a copy for every method for each concrete type.
Another kind of data has duplication is EEClass and MethodTable. EEClass and MethodTable is type specific data. Strictly speaking, such data don't get duplicated because they are unique to each concrete type.
How .net tries to avoid explosion
In .net framework, two methods are adopted to minimize code explosion.
1. Different invokes of a generic method with the same type argument share the same copy of native code. This only takes effect when these invokes are in the same appdomain.
2. The CLR considers all reference type arguments to be identical. It does this based on the fact that reference variables are pointers (kind of, not accurate expression) to object on the heap. They can be manipulated in the same way.
Verify the optimization
In order to verify that the optimization method acutally behaves that way, we create the following sample and debug it with windbg.
static void Main()
{
List<int> intList = new List<int>();
List<object> objList = new List<object>();
List<system.delegate> delList = new List<system.delegate>();
}
Input sxe ld:mscorlib to instruct windbg to break when the application loads mscorlib module
When windbg breaks, input .loadby sos mscorwks to load sos.dll
Input .chain to confirm the sos extension has been successfully loaded
C:\WINDOWS\Microsoft.NET\Framework\v2.0.50727\sos: image 2.0.50727.3053, API 1.0.0, built Fri Jul 25 22:08:38 2008
[path: C:\WINDOWS\Microsoft.NET\Framework\v2.0.50727\sos.dll]
Input !bpmd Test.exe Test.Program.Main to set a managed breakpoint in Main method
Input p command several times until we see System.Collections.Generic.List`1 object on the managed stack with !dso command. The output below shows objects we are interested in:
ESP/REG  Object   Name
0019e3a4 01e6bc04 System.Collections.Generic.List`1[[System.Delegate, mscorlib]]
0019e5c4 01e6bbec System.Collections.Generic.List`1[[System.Object, mscorlib]]
0019e5c8 01e6bbc8 System.Collections.Generic.List`1[[System.Int32, mscorlib]]
Input !do 01e6bc04 to dump the first object and we get:
Name: System.Collections.Generic.List`1[[System.Delegate, mscorlib]]
MethodTable: 008126a4
EEClass: 698fca68
Size: 24(0x18) bytes
(C:\Windows\assembly\GAC_32\mscorlib\2.0.0.0__b77a5c561934e089\mscorlib.dll)
Fields:
MT    Field   Offset                 Type VT     Attr    Value Name
69b140bc  40009d8        4      System.Object[]  0 instance 01e6bc1c _items
69b42b38  40009d9        c         System.Int32  1 instance        0 _size
69b42b38  40009da       10         System.Int32  1 instance        0 _version
69b40508  40009db        8        System.Object  0 instance 00000000 _syncRoot
69b140bc  40009dc        0      System.Object[]  0   shared   static _emptyArray
Domain:Value dynamic statics NYI
002efb90:NotInit
...
Input !dumpmt -md 008126a4 to dump method table for this object. We get:
EEClass: 698fca68
Module: 698d1000
Name: System.Collections.Generic.List`1[[System.Delegate, mscorlib]]
mdToken: 0200028d  (C:\Windows\assembly\GAC_32\mscorlib\2.0.0.0__b77a5c561934e089\mscorlib.dll)
BaseSize: 0x18
ComponentSize: 0x0
Number of IFaces in IFaceMap: 6
Slots in VTable: 77
--------------------------------------
MethodDesc Table
Entry MethodDesc      JIT Name
69a96a70   69914934   PreJIT System.Object.ToString()
69a96a90   6991493c   PreJIT System.Object.Equals(System.Object)
69a96b00   6991496c   PreJIT System.Object.GetHashCode()
69b072f0   69914990   PreJIT System.Object.Finalize()
69aef320   69913310   PreJIT System.Collections.Generic.List`1[[System.__Canon, mscorlib]].Add(System.__Canon)
69b03f00   69913318   PreJIT System.Collections.Generic.List`1[[System.__Canon, mscorlib]].System.Collections.IList.Add(System.Object)
And we do the same thing to dump method table for the 2nd and 3rd object. The output is:
EEClass: 698fca68
Module: 698d1000
Name: System.Collections.Generic.List`1[[System.Object, mscorlib]]
mdToken: 0200028d  (C:\Windows\assembly\GAC_32\mscorlib\2.0.0.0__b77a5c561934e089\mscorlib.dll)
BaseSize: 0x18
ComponentSize: 0x0
Number of IFaces in IFaceMap: 6
Slots in VTable: 77
--------------------------------------
MethodDesc Table
Entry MethodDesc      JIT Name
69a96a70   69914934   PreJIT System.Object.ToString()
69a96a90   6991493c   PreJIT System.Object.Equals(System.Object)
69a96b00   6991496c   PreJIT System.Object.GetHashCode()
69b072f0   69914990   PreJIT System.Object.Finalize()
69aef320   69913310   PreJIT System.Collections.Generic.List`1[[System.__Canon, mscorlib]].Add(System.__Canon)
69b03f00   69913318   PreJIT System.Collections.Generic.List`1[[System.__Canon, mscorlib]].System.Collections.IList.Add(System.Object)

EEClass: 698f6c3c
Module: 698d1000
Name: System.Collections.Generic.List`1[[System.Int32, mscorlib]]
mdToken: 0200028d  (C:\Windows\assembly\GAC_32\mscorlib\2.0.0.0__b77a5c561934e089\mscorlib.dll)
BaseSize: 0x18
ComponentSize: 0x0
Number of IFaces in IFaceMap: 6
Slots in VTable: 77
--------------------------------------
MethodDesc Table
Entry MethodDesc      JIT Name
69a96a70   69914934   PreJIT System.Object.ToString()
69a96a90   6991493c   PreJIT System.Object.Equals(System.Object)
69a96b00   6991496c   PreJIT System.Object.GetHashCode()
69b072f0   69914990   PreJIT System.Object.Finalize()
69fd3b60   699ac468   PreJIT System.Collections.Generic.List`1[[System.Int32, mscorlib]].Add(Int32)
69fd2f80   699ac470   PreJIT System.Collections.Generic.List`1[[System.Int32, mscorlib]].System.Collections.IList.Add(System.Object)
From the output, we can easily identify that the method for objList and delList are the same, but the method for intList is different. So we've verified that the code for concrete type of reference type argument are shared.
Although the code is shared, these objects' EEClass are different. So they are actually different types.
Given the debugging skill above, we can also easily verify that different generic instances defined with the same type argument in different scope have the same EEClass.
References:
Drill Into .NET Framework Internals to See How the CLR Creates Runtime Objects
Langganan:
Postingan (Atom)