Laman

New

a

Tampilkan postingan dengan label linux. Tampilkan semua postingan

Minggu

install zeal on ubuntu 12.04

dash is an excellent API documentation browser on OSX. It supports offline documentation sets for lots of programming language, and search in dash is a lot faster than search on web. You can have access to documentation instantly, even if you don't have network access. Fortunately, programmers working on windows, linux platform, can use zeal, which is a opensource clone of dash.
zeal
The easy way to install zeal on Ubuntu is to install from the PPA . But we can't use this option, because zeal depends on Qt5, but we can't install Qt5 on system standard location to avoid confication with Qt4, which is used for our product development. So, we choose to install Qt5 in /opt directory and build zeal ourselves.
A problem with build zeal is it requires c++11 support, which isn't supported by gcc v4.6. But we can't upgrade to newer version. So, we choose to use clang v3.3 (or newer version) to build zeal.
  1. Download qt5 installer from https://qt-project.org/downloads and install to /opt
  2. Install required packages and clang:
    sudo apt-get install libgstreamer-plugins-base0.10-dev libxslt-dev libxml2-dev libxcb-keysyms1-dev bsdtar clang-3.3 libclang1-3.3
  3. Download zeal source code:
    git clone https://github.com/jkozera/zeal.git
  4. Run
    /opt/Qt5.2.1/5.2.1/gcc_64/bin/qmake -spec linux-clang && make && sudo make install

Kamis

buildroot for raspberrypi

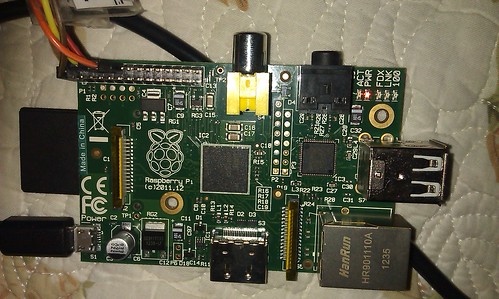
I bought a raspberrypi to try some interseting ideas on.
raspberry_pi_image
raspberrypi provides several images for downloading, but they are too large and exceeds my needs. My desired raspberrypi image should meet:
  1. fully customizing capabilities on kernel and user applications
  2. python support
  3. standard c&c++ libiaries
  4. serial port communication with peripheral devices
Luckily, here is a buildroot project customized for raspberrypi. With buildroot, all my requirements can be easily satisfied. So I forked from the repository and made some changes, to make the targe image minimal.
  1. disable Qt5 library
  2. disable boost library
  3. change kernel to the official one maintained by raspberrypi team
To build the target image, run commands below:
cp configs/raspberry_simple_defconfig .config
make
After the build is finished. I just need to copy the output/build/linux-rpi-3.6.y/arch/arm/boot/Image to kernel.img on boot partition on the sd card, and untar output/images/rootfs.tar to root filesystem partition.
Power on, and now raspberry pi should be running our own system.

Senin

examine macro definition in gdb

When debugging a c++ application, I used to refer to source code to find out the actual definition of a macro. If the macro is not a simple one, I had to perform the expansion on a paper or use the 'gcc -E' command to find out what's the actual result. This is a tedious task. The gdb macro command helps examine the macro value, as long as the application under debugging contains information about preprocessor macros. This can be satisfied by passing -g3 option to the gcc compiler. As an example, we need to debug the application below
 1 #define FOO foo_value
 2 #define STR(val) "STR of "#val
 3 #define VAL STR(FOO)
 4 
 5 int main(int argc, const char *argv[])
 6 {
 7     const char* t = VAL;
 8 #undef VAL
 9 #define VAL "test" // define VAL to a different value 
10     const char* t2 = VAL;
11 
12     return 0;
13 }
We compile the code with gcc -g3 command, and debug it in gdb. Then we can examine the actual value of VAL macro with macro exp command.
(gdb) macro exp VAL  // run when break on line 7
expands to: "STR of ""FOO"
....
(gdb) macro exp VAL // run when break on line 10
expands to: "test"
It's worthy of note that the macro expansion is context awareness in gdb, so we can get different value when the application breaks on line 7 and 10.

Kamis

debug linux kernel with gdb

People often use gdb to debug user mode applications, which is a convenient debugging means. It's also possible to use gdb to debug linux kernel and drivers with the help of kgdb. This page is a good tutorial for how to use kgdb.

Benefits of using gdb to debug kernel

  • It helps us understanding linux internals. In linux, it's very common to see structures with a lot of function pointer members being passed around. And it's not easy to find out where and how these function pointers are actually called by reading code. By setting breakpoint on the function, we can easily find how linux call into it.
  • It saves the debugging time. If we only debug by printk, we usually have to compile and deploy linux kernel multiple times to fix a minor bug. It's more efficient to debug if we can step through the code and see all variables' value in real time.

Preparations

As the precedent document illustrates, to enable kgdb for a kernel, we need to:
  • Enable kernel config options for kgdb
  • Provide a polling tty driver for the kgdboc I/O driver.
  • Set linux boot argument to instruct linux kernel use our kgdb I/O driver

How to complete a kgdb I/O driver

Linux contains a kgdb I/O driver, kgdboc, short for kgdb over console. It's acutally a thin driver that relies on low level hardware driver supporting polling operation. This low level driver must be implemented by us.
To complete the polling driver, we need to implement poll_get_char and poll_put_char callbacks in the UART driver. There is a good example for us to follow in linux source code: 8250.c.

How to debug if there is only one serial port

kgdboc is designed to work when there is only one serial port on our board. The serial port can be used as primary console as well as the communication channel with gdb. In this case, we should first connect our serial port client (e.g., kermit) to the console and input 'echo g > /proc/sysrq-trigger' command to break into linux kernel. Now linux should halt and wait for a gdb client to connect. Then we exit the serial port client process and start a gdb client to connect to the linux on the same serial port. It's time-division multiplexing on the serial port.
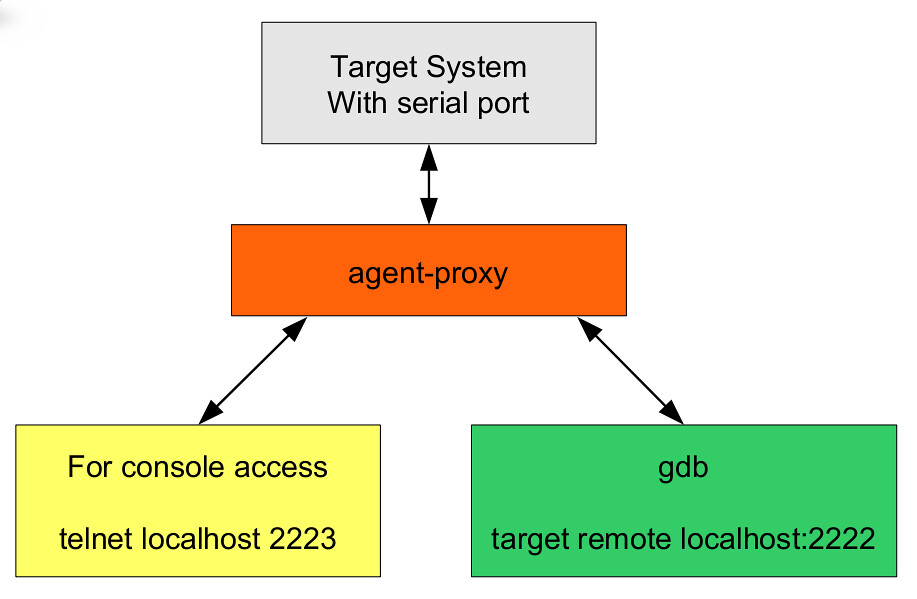
The agent-proxy make the process even easier. agent-proxy is a tty to tcp connection mux that allow us connect more than one client application to a tty. By using it, we can run the serial port client and gdb process simultaneously. aa

How to debug linux initialization code

If we specify kgdbwait parameter in kernel boot args, the kernel will halt automatically during the initialization process and wait for a gdb client to connect. There are several things to note:
  • The kgdb core tries to break the execution as soon as a kgdb io driver is registered, which is done while the kgdboc module is initialized. As a result, it's necessary to set kgdboc module as built-in, rather than a module.
  • Our UART driver must be initialized before the kgdboc driver. Or the kgdboc driver will fail to initialize. Becuase there isn't a reliable way to specify loading order for built-in modules at the same level, it's better to specify our UART driver at a precedent level than kgdboc, for instance, fs_initcall.
  • The module initialization is called through this call stack: start_kernel -> rest_init -> kernel_init -> do_basic_setup -> do_initcalls. So, we can't debug code earlier than do_initcalls.

How to debug loadable module

When we need to debug a loadable module, we should add the ko file with symbol information to gdb with add-symbol-file command. We must provide the module's load address explicitly. How can we find out where the module is loaded? After we've insmod the module, we can find out the load address of the module by either read the /proc/modules pseudo file or use info shared command in gdb. But what if we need to debug the module_init function? It will be too late to set breakpoint after we've alreay loaded the module to find out its load address. We can solve this dilemma by setting a breakpoint in sys_init_module after the load_module function returns. And we can find out the module's load address with p mod->module_core command in gdb. We can add symbol file at this point and set a breakpoint in the actual module_init function. Or we can set a breakpoint in do_one_initcall.

Rabu

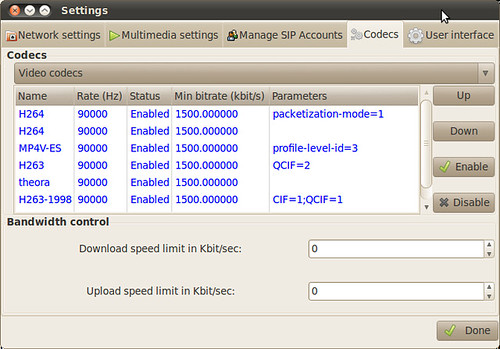
install h.264 plugin for linphone on ubuntu

h.264 plugin isn't a standard part of linphone installation on ubuntu. We must manually compile and install it.

1. Download msx264 plugin source code.
2. Run sudo apt-get install libmediastreamer-dev libx264-dev libavcodec-dev libswscale-dev libtheora-dev to meet msx264's dependency requirements.
3. Run ./configure --prefix=/usr/lib. It's mandatory to set prefix to /usr/lib, because linphone can't find the plugin if it's installed in default location, /usr/local/lib.
4. Run sudo make install.
5. Change the line 393 in src/msx264.c from


393     if (sws_scale(s->sws_ctx,(uint8_t * const*)orig->data,orig->linesize, 0,

to


393     if (sws_scale(s->sws_ctx,(uint8_t **)orig->data,orig->linesize, 0,

to get rid of compilation error, if you have.

6. Restart linphone, the h.264 plugin should be available now.

Jumat

install fcitx input method on ubuntu

The default scim input method doesn't work well with freemind on my computer, so I'd like to switch to fcitx. The fcitx package in ubuntu repository is an old version, and to install fcitx manually isn't very straightforward, so I make this post about how I managed to get it to work.

1. Download fcitx source code and extract.
2. Make sure all dependent libraries are installed:
sudo apt-get install libpango1.0-dev libcairo2-dev xorg-dev libtool gettext intltool
3. Run configure && make && make install
4. At this time, fcitx failed to run and gave following error:  fcitx: error while loading shared libraries: libfcitx-config.so.4: cannot open shared object file: No such file or directory. To fix it, create a symbol link in /usr/lib with this command:

sudo ln -s /usr/local/lib/libfcitx-config.so /usr/lib/libfcitx-config.so.4
5. Create /etc/X11/xinit/xinput.d/fcitx file with below content. Alternatively we can place them in ~/.profile.
XIM=fcitx
XIM_PROGRAM=/usr/local/bin/fcitx
XIM_ARGS=""
GTK_IM_MODULE=XIM
QT_IM_MODULE=XIM
DEPENDS="fcitx"
6. Edit /usr/lib/gtk-2.0/2.10.0/immodule-files.d/libgtk2.0-0.immodules file, change the line
"xim" "X Input Method" "gtk20" "/usr/share/locale" "ko:ja:th:zh"
to
"xim" "X Input Method" "gtk20" "/usr/share/locale" "en:ko:ja:th:zh"
7. Restart

To make fcitx more convenient to use, I run fcitx-config and change configurations below.
# Candidate Word Number
CandidateWordNumber=9
# Main Window Hide Mode
MainWindowHideMode=Auto
# Show Input Window After Trigger Input Mode
ShowInputWindowAfterTriggering=False
# Show Input Speed
ShowInputSpeed=False

Reference:
fcitx4.pdf

recovering GRUB bootloader on windows/ubuntu dual boot machine

I installed both windows and ubuntu on my laptop. It's easy to dual boot because I installed ubuntu after windows. But for some reasons, I have to reinstall windows.
And after windows is installed, dual boot no longer work because windows installer overwrited the mbr. I didn't want to install ubuntu again, and luckily, I found this: Dual Boot Ubuntu and Windows.
In short, we can fix the grub with following steps:
  1. Boot with ubuntu live cd
  2. Mount the ubuntu installation file system
  3. Reinstall grub with "grub-setup -d ubuntu_installation_path/boot/grub" command

Fix bugs with core dump

A perplexity developers usually meet is they release the product to qa team and get a feedback of occasional crash. And the testers don't have a solid reproduction steps. In this case, it's a time-consuming task to find out the cause and fix it. What we need is an efficient postmortem debugging method.

Core dump is a mechanism provided by operating system to automatically capture the address apace of a crashed process into a dump file that can be used to help us debugging.

How to enable it
In most linux distributions, core dump is disabled by default. This can be validated by running "ulimit -a" command from shell. We are very likely to see the results below:
core file size (blocks, -c) 0

It indicates core dump is diabled. To enble it, the simpliest way is invoking "ulimit -c unlimited" command. Ulimit is a bash builtin command, and it only takes effect for current shell and all porcesses spawned in this shell.
If we want to enable it permanently for a user, we can add the command to the ~/.bashrc file.
If we want to enable it globally, we can edit the /etc/security/limits.conf file by setting
* soft core unlimited

Customize core dump name
By default, the core dump file will be created in the same directory that the application is running in with fixed file name "core". The name conforms to the definition in /proc/sys/kernal/core_pattern file.
This pattern can be changed via "sysctl -w kernel.core_pattern=DesiredValue" command. Again, this setting is't persisted. To make it permanent, we can edit the /etc/sysctl.conf file and add the line "kernel.core_pattern=DesiredValue" to it.
The list below is some place holder can be used in the naming pattern to make it more flexible.

%% A single % character
%p PID of dumped process
%u real UID of dumped process
%g real GID of dumped process
%s number of signal causing dump
%t time of dump (seconds since 0:00h, 1 Jan 1970)
%h hostname (same as ’nodename’ returned by uname(2))
%e executable filename

Example
And here is an exmple.

#Makefile
EXE = test
CC = g++
#CFLAGS += -Os
# add debug information
CFLAGS += -g
CFLAGS += -Wall

all:
$(CC) $(CFLAGS) test.cpp -o $(EXE)

.PHONY: clean

clean:
rm $(EXE) -rf


// source code
#include

using namespace std;

void foo()
{
char *buf = "aa";
cout << "before exception" <<>
buf[0] = 'b';// invalid code
cout << "after exception" <<>
}

int main()
{
foo();
return 0;
}


Every time we run the application, it will crash and generate a core dump file. We can analysis the dump file with gdb (gdb test core_dump_file).

Capture live core dump
It's also desirable to capture core dump of a process when it's still running. Such dump is useful for trouble shooting contention and dead lock issues. gcore is the right tool for this purpose.

Reference
http://linuxfocus.berlios.de/English/July2004/article343.shtml